autoPET-III
The tracer frontier
Introduction
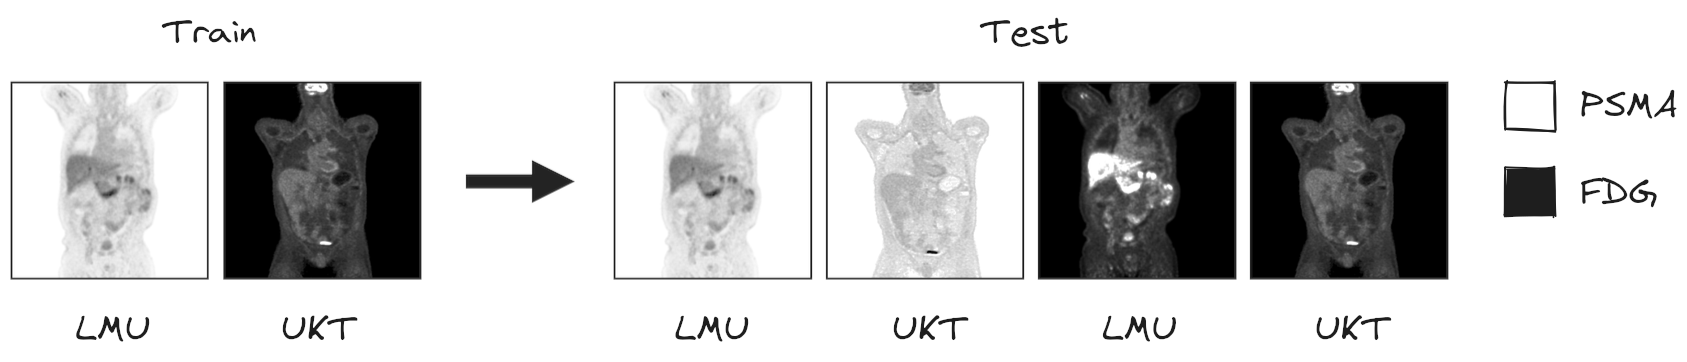
We invite you to participate in the third autoPET Challenge. The focus of this year's challenge is to further refine the automated segmentation of tumor lesions in Positron Emission Tomography/Computed Tomography (PET/CT) scans in a multitracer multicenter setting. Over the past decades, PET/CT has emerged as a pivotal tool in oncological diagnostics, management and treatment planning. In clinical routine, medical experts typically rely on a qualitative analysis of the PET/CT images, although quantitative analysis would enable more precise and individualized tumor characterization and therapeutic decisions. A major barrier to clinical adoption is lesion segmentation, a necessary step for quantitative image analysis. Performed manually, it's tedious, time-consuming and costly. Machine Learning offers the potential for fast and fully automated quantitative analysis of PET/CT images, as previously demonstrated in the first two autoPET challenges. Building upon the insights gained in these challenges, autoPET III expands the scope to address the critical need for models to generalize across multiple tracers and centers. To this end, we provide participants access to a more diverse PET/CT dataset containing images of two different tracers - Prostate-Specific Membrane Antigen (PSMA) and Fluorodeoxyglucose (FDG) acquired from two different clinical sites (Figure). In this challenge, we give participants the chance to let their models compete in two award categories. In award category one, participants are tasked with developing robust segmentation algorithms applicable to two different tracers. In award category two, the significance of data quality and preprocessing in algorithm performance is addressed. Here, participants are encouraged to enhance our baseline model using innovative data pipelines, fostering advancements in data-centric approaches to automated PET/CT lesion segmentation. Join us in autoPET III to pave the way for robust deep-learning-based medical image analysis in PET/CT, optimizing diagnostics and personalizing therapy guidance in oncology.
AutoPET-III is hosted at the MICCAI 2024: ![]()
and supported by the European Society for hybrid, molecular and translational imaging (ESHI). The challenge is the successor of autoPET and autoPET II.
Grand Challenge
More information about the challenge can be found on Grand Challenge.Task
Based on the insights of the last two autoPET challenges, we expand the scope of the autoPET III challenge to the primary task of achieving multitracer multicenter generalization of automated lesion segmentation.
To this end, we provide participants access to two different PET/CT training datasets: a large, annotated FDG-PET/CT dataset acquired at the University Hospital Tübingen, Germany (UKT), and a large, annotated PSMA-PET/CT dataset acquired at LMU Hospital, LMU Munich, Germany (LMU). The FDG-UKT dataset was already used in the autoPET I and II challenges. The PSMA-LMU dataset is new. It encompasses 597 PET/CT volumes of male patients diagnosed with prostate carcinoma from LMU Hospital and shows a significant domain shift from the UKT training data (different tracers, different PET/CT scanners, and acquisition protocols). Algorithms will be tested on PSMA and FDG data from LMU and UKT, respectively.
In addition, we will have a second award category, where participants are invited to submit our baseline model trained with their advanced data pipelines. This category is motivated by the observation that in autoPET I and II, data quality and handling in pre- and post-processing posed significant bottlenecks. Due to the rarity of publicly available PET data in the medical deep learning community, there is no standardized approach to preprocess these images (normalization, augmentations, etc.). The second award category will thus additionally promote data-centric approaches to automated PET/CT lesion segmentation.
Testing will be performed on 200 studies (held-out test database). Test data will be drawn in part (50%) from the same sources and distributions as the training data. The other part will be drawn crosswise from the other center, i.e. PSMA from Tuebingen (25%) and FDG from LMU (25%).
I.) Accurate segmentation of FDG- and PSMA-avid tumor lesions in whole-body PET/CT images. The specific challenge in automated segmentation of lesions in PET/CT is to avoid false-positive segmentation of anatomical structures that have physiologically high uptake while capturing all tumor lesions. This task is particularly challenging in a multitracer setting since the physiological uptake partly differs for different tracers: e.g. brain, kidney, heart for FDG and e.g. liver, kidney, spleen, submandibular for PSMA.
II.) Robust behavior of the to-be-developed algorithms with respect to moderate changes in the choice of tracer, acquisition protocol, or acquisition site. This will be reflected by the test data which will be drawn partly from the same distribution as the training data and partly from a different hospital with a similar, but slightly different acquisition setup.
We encourage two submission tracks:
1.) Best generalizing model: Best ranked model wins! The rules are simple: Train a model which generalizes well on FDG and PSMA data. Or train two models and combine them? You are free to choose. You can use additional data which is publicly available.
2.) Datacentrism: Best data-handling wins! In real-world applications, especially in the medical domain, data is messy. Improving models is not the only way to get better performance. You can also improve the dataset itself rather than treating it as fixed. This is the core idea of a popular research direction called Data-Centric AI (DCAI). Examples are outlier detection and removal (handling abnormal examples in dataset), error detection and correction (handling incorrect values/labels in dataset), data augmentation (adding examples to data to encode prior knowledge) and many more. If you are interested: a good resource to start is DCAI. The rules are: Train a model which generalizes well on FDG and PSMA data but DO NOT alter the model architecture or get lost in configuration ablations. For that we will provide a second baseline container and a tutorial how to use and train the model. You are not allowed to use any additional data and the datacentric baseline model will be in competition.
Database
The challenge cohort consists of patients with histologically proven malignant melanoma, lymphoma or lung cancer as well as negative control patients who were examined by FDG-PET/CT in two large medical centers (University Hospital Tübingen, Germany & University Hospital of the LMU in Munich, Germany).
The FDG cohort comprises 501 patients diagnosed with histologically proven malignant melanoma, lymphoma, or lung cancer, along with 513 negative control patients. The PSMA cohort includes pre- and/or post-therapeutic PET/CT images of male individuals with prostate carcinoma, encompassing images with (537) and without PSMA-avid tumor lesions (60). Notably, the training datasets exhibit distinct age distributions: the FDG UKT cohort spans 570 male patients (mean age: 60; std: 16) and 444 female patients (mean age: 58; std: 16), whereas the PSMA MUC cohort tends to be older, with 378 male patients (mean age: 71; std: 8). Additionally, there are variations in imaging conditions between the FDG Tübingen and PSMA Munich cohorts, particularly regarding the types and number of PET/CT scanners utilized for acquisition. The PSMA Munich dataset was acquired using three different scanner types (Siemens Biograph 64-4R TruePoint, Siemens Biograph mCT Flow 20, and GE Discovery 690), whereas the FDG Tübingen dataset was acquired using a single scanner (Siemens Biograph mCT).
🎥 PET/CT acquisition protocol
FDG dataset: Patients fasted at least 6 h prior to the injection of approximately 350 MBq 18F-FDG. Whole-body PET/CT images were acquired using a Biograph mCT PET/CT scanner (Siemens, Healthcare GmbH, Erlangen, Germany) and were initiated approximately 60 min after intravenous tracer administration. Diagnostic CT scans of the neck, thorax, abdomen, and pelvis (200 reference mAs; 120 kV) were acquired 90 sec after intravenous injection of a contrast agent (90-120 ml Ultravist 370, Bayer AG) or without contrast agent (in case of existing contraindications). PET Images were reconstructed iteratively (three iterations, 21 subsets) with Gaussian post-reconstruction smoothing (2 mm full width at half-maximum). Slice thickness on contrast-enhanced CT was 2 or 3 mm.
PSMA dataset: Examinations were acquired on different PET/CT scanners (Siemens Biograph 64-4R TruePoint, Siemens Biograph mCT Flow 20, and GE Discovery 690). The imaging protocol mainly consisted of a diagnostic CT scan from the skull base to the mid-thigh using the following scan parameters: reference tube current exposure time product of 143 mAs (mean); tube voltage of 100kV or 120 kV for most cases, slice thickness of 3 mm for Biograph 64 and Biograph mCT, and 2.5 mm for GE Discovery 690 (except for 3 cases with 5 mm). Intravenous contrast enhancement was used in most studies (571), except for patients with contraindications (26).
The whole-body PSMA-PET scan was acquired on average around 74 minutes after intravenous injection of 246 MBq 18F-PSMA (mean, 369 studies) or 214 MBq 68Ga-PSMA (mean, 228 studies), respectively. The PET data was reconstructed with attenuation correction derived from corresponding CT data. For GE Discovery 690 the reconstruction process employed a VPFX algorithm with voxel size 2.73 mm × 2.73 mm × 3.27 mm, for Siemens Biograph mCT Flow 20 a PSF+TOF algorithm (2 iterations, 21 subsets) with voxel size 4.07 mm × 4.07 mm × 3.00 mm, and for Siemens Biograph 64-4R TruePoint a PSF algorithm (3 iterations, 21 subsets) with voxel size 4.07 mm × 4.07 mm × 5.00 mm.
⌛ Training and test cohort
Training cases: 1,014 studies (900 patients) and 597 PSMA studies (378 patients)
Test cases (final evaluation): 200 studies (50 FDG LMU, 50 FDG UKT, 50 PSMA LMU, 50 PSMA UKT)
Test cases (preliminary evaluation): 5 studies
A case (training or test case) consists of one 3D whole body FDG-PET volume, one corresponding 3D whole body CT volume and one 3D binary mask of manually segmented tumor lesions on FDG-PET of the size of the PET volume. CT and PET were acquired simultaneously on a single PET/CT scanner in one session; thus PET and CT are anatomically aligned up to minor shifts due to physiological motion.
Training set
Training data consists of 1,014 FDG PET/CT studies and 597 PSMA PET/CT studies. We provide the merged data in nnUNet format. The download will contain the resampled FDG and PSMA data as NiFTI files. It also contains the files obtained by running the nnUNet fingerprint extractor and a splits file which we use to design/train our baselines.
NiFTI:
|--- imagesTr
	|--- tracer_patient1_study1_0000.nii.gz  (CT image resampled to PET)

	|--- tracer_patient1_study1_0001.nii.gz  (PET image in SUV)
	|--- ...
|--- labelsTr
	|--- tracer_patient1_study1.nii.gz       (manual annotations of tumor lesions)

|--- dataset.json                             (nnUNet dataset description)
|--- dataset_fingerprint.json                 (nnUNet dataset fingerprint)

|--- splits_final.json                        (reference 5fold split)

|--- psma_metadata.csv                        (metadata csv for psma)

|--- fdg_metadata.csv                         (original metadata csv for fdg)
FDG PET/CT
FDG PET/CT training data contains 1,014 studies acquired at the University Hospital Tübingen and is made publicly available on TCIA (as DICOM, NiFTI and HDF5 files). After download, you can convert the DICOM files to e.g. the NIfTI format using scripts provided here.
DICOM:NiFTI:
If you use this data, please cite:
Gatidis S, Kuestner T. A whole-body FDG-PET/CT dataset with manually annotated tumor lesions (FDG-PET-CT-Lesions) [Dataset]. The Cancer Imaging Archive, 2022. DOI: 10.7937/gkr0-xv29
PSMA PET/CT
PSMA PET/CT training data contains 597 studies acquired at the University Hospital Munich and is made publicly available on TCIA. After download, you can convert the DICOM files to e.g. the NIfTI format using scripts provided here.
DICOM:NiFTI:
If you use this data, please cite:
Jeblick, K., et al. A whole-body PSMA-PET/CT dataset with manually annotated tumor lesions (PSMA-PET-CT-Lesions) (Version 1) [Dataset]. The Cancer Imaging Archive, 2024. DOI: 10.7937/r7ep-3x37
Preliminary test set
For the self-evaluation of participating pipelines, we provide access to a preliminary test set. The preliminary test set uses the same imaging data as the final test set, but consists of 5 studies only.
The access to this preliminary set is restricted and only possible through the docker containers submitted to the challenge, and only available for a limited time during the competition. The purpose of this is that participants can check the sanity of their approaches.
Final test set
The final test set consists of 200 studies.
🗃️ Data pre-processing and structure
In a pre-processing step, the TCIA DICOM files are resampled (CT to PET imaging resolution, i.e. same matrix size) and normalized (PET converted to standardized update values; SUV). For the challenge, the pre-processed data will be provided in NifTI format. PET data is standardized by converting image units from activity counts to standardized uptake values (SUV). We recommend to use the resampled CT (CTres.nii.gz) and the PET in SUV (SUV.nii.gz). The mask (SEG.nii.gz) is binary with 1 indicating the lesion. The training and test database have the following structure:
|--- Patient 1
	|--- Study 1
		 |--- SUV.nii.gz    (PET image in SUV)
		 |--- CTres.nii.gz  (CT image resampled to PET)
		 |--- CT.nii.gz     (Original CT image)
		 |--- SEG.nii.gz    (Manual annotations of tumor lesions)
		 |--- PET.nii.gz    (Original PET image as actictivity counts)
	|--- Study 2            (Potential 2nd visit of same patient)
		 |--- ...
|--- Patient 2
	|--- ...
import nibabel as nib
SUV = nib.load(os.path.join(data_root_path, 'PETCT_0af7ffe12a', '08-12-2005-NA-PET-CT Ganzkoerper  primaer mit KM-96698', 'SUV.nii.gz'))
PETCT_0af7ffe12a is the fully anonymized patient and 08-12-2005-NA-PET-CT Ganzkoerper primaer mit KM-96698 is the anonymized study (randomly generated study name, date is not reflecting scan date).
✒ Annotation
FDG PET/CT training and test data from UKT was annotated by a Radiologist with 10 years of experience in Hybrid Imaging and experience in machine learning research. FDG PET/CT test data from LMU was annotated by a radiologist with 8 years of experience in hybrid imaging. PSMA PET/CT training and test data from LMU as well as PSMA PET/CT test data from UKT was annotated by a single reader and reviewed by a radiologist with 5 years of experience in hybrid imaging. br/>
The following annotation protocol was defined:
Step 1: Identification of FDG-avid tumor lesions by visual assessment of PET and CT information together with the clinical examination reports.
Step 2: Manual free-hand segmentation of identified lesions in axial slices.
Evaluation
Evaluation will be performed on held-out test cases of 200 patients. Test data will be drawn in part (50%) from the same sources and distributions as the training data, i.e. 50 PSMA-PET/CT scans from LMU, 50 FDG-PET/CT scans from UKT. The other part will be drawn crosswise from the other center, i.e. 50 PSMA-PET/CT scans from UKT and 50 FDG-PET/CT scans from LMU. A combination of two metrics reflecting the aims and specific challenges for the task of PET lesion segmentation:
- Foreground Dice score of segmented lesions
- Volume of false positive connected components that do not overlap with positives (=false positive volume)
- Volume of positive connected components in the ground truth that do not overlap with the estimated segmentation mask (=false negative volume)
A python script computing these evaluation metrics is provided under https://github.com/lab-midas/autoPET.
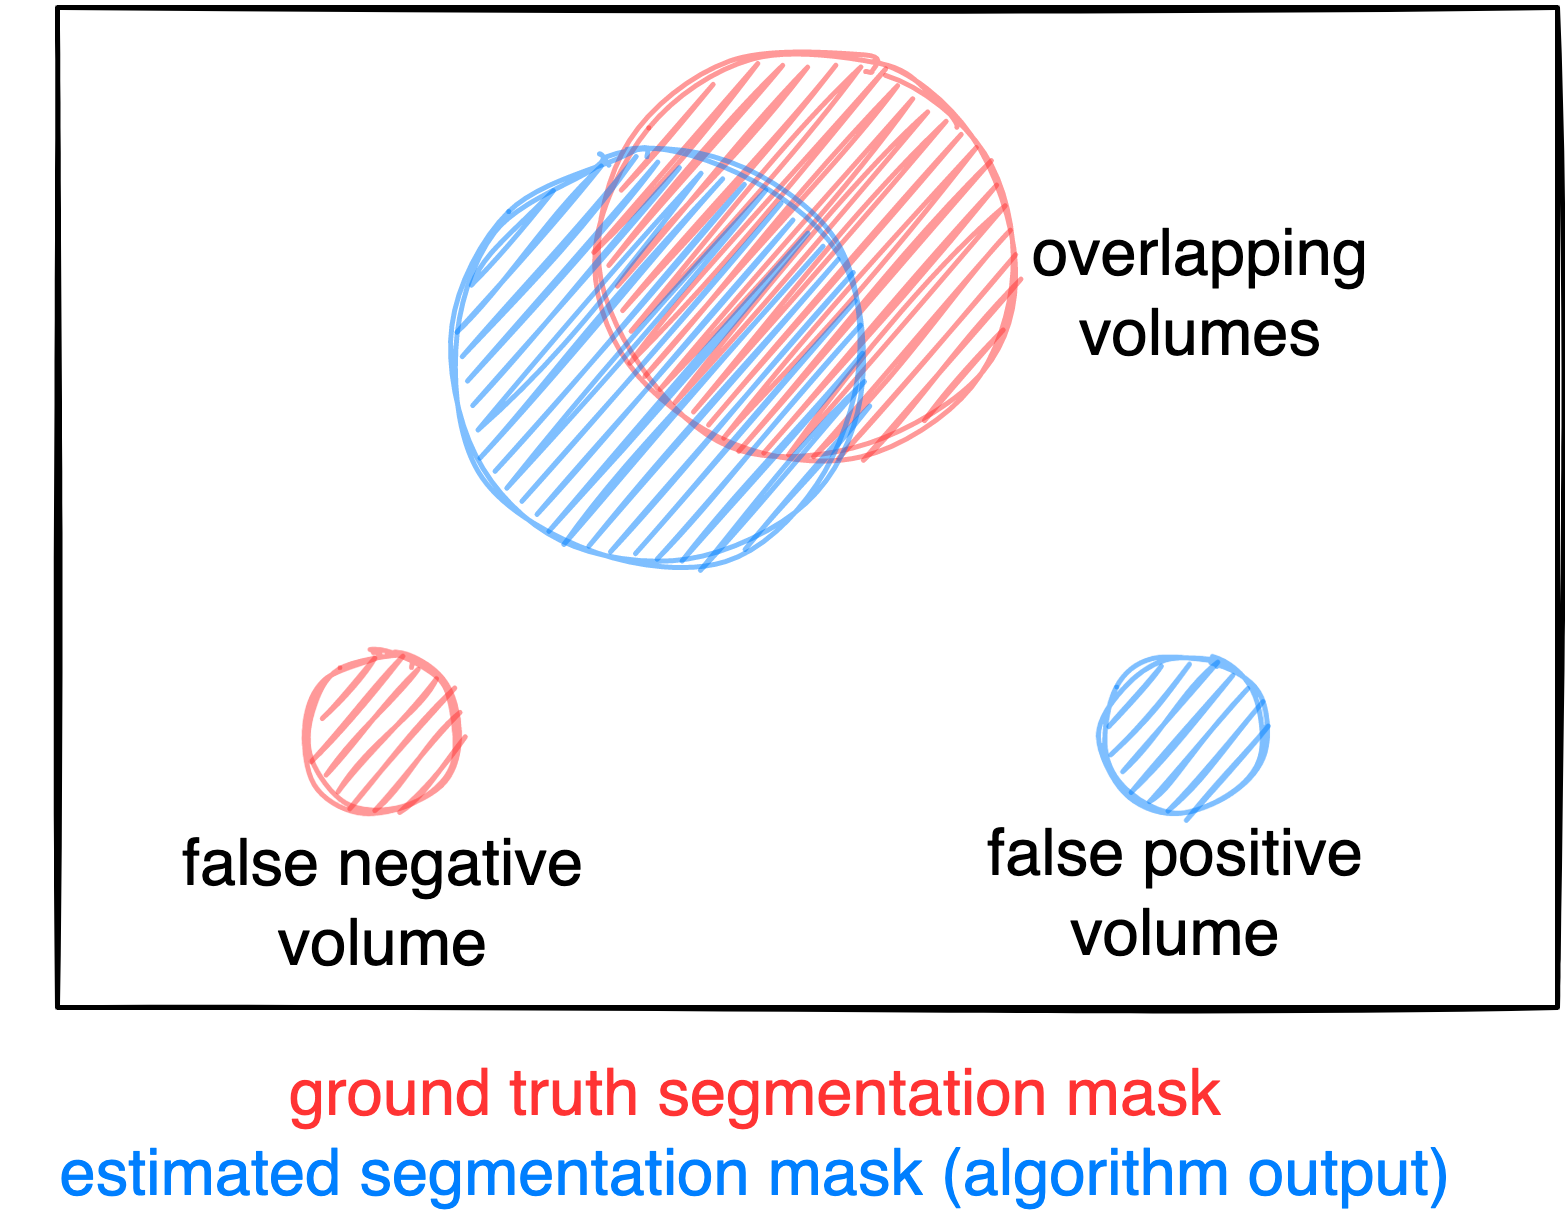
Figure: Example for the evaluation. The Dice score is calculated to measure the correct overlap between predicted lesion segmentation (blue) and ground truth (red). Additionally special emphasis is put on false positives by measuring their volume, i.e. large false positives like brain or bladder will result in a low score and false negatives by measuring their volume (i.e. entirely missed lesions).
Ranking
The submitted algorithms will be ranked according to:
Step 1: Divide the test dataset into subsets based on center and tracer (i.e., PSMA LMU, PSMA UKT, FDG LMU, FDG UKT) and calculated the average metrics for Dice, FPV, and FNV within each subset.
Step 2: Rank the subset averages across all algorithms. For each metric, we computed an intermediate average rank by averaging the ranks of the subsets.
Step 3: Generate the overall rank by combining the three metric ranks using a weighting factor: Dice (0.5), FPV (0.25), and FNV (0.25). In case of equal ranking, the achieved Dice metric will be used as a tie break.
Award category 1: Modelcentric
Best ranked model wins! (for Dice: higher score = better, for FP or FN: lower volumes = better)
Award category 2: Datacentrism
Best data-handling wins!
Codes and Models
Codes
https://github.com/ClinicalDataScience/autoPETIII
Models
Models and documentation of the submitted challenge algorithms can be found in the Leaderboard.
Leaderboard
Category 1: Modelcentric
| # | Team | Mean Position | Dice (Position) | False Negative Volume (Position) | False Positive Volume (Position) | Model | Documentation | ||||||||||||
|---|---|---|---|---|---|---|---|---|---|---|---|---|---|---|---|---|---|---|---|
| LMU FDG | LMU PSMA | UKT FDG | UKT PSMA | Overall rank | LMU FDG | LMU PSMA | UKT FDG | UKT PSMA | Overall rank | LMU FDG | LMU PSMA | UKT FDG | UKT PSMA | Overall rank | |||||
| 1 | LesionTracer | 6.0625 | 0.6619 (3) | 0.6433 (1) | 0.7702 (7) | 0.5711 (8) | 4.75 | 1.7810 (1) | 10.1590 (8) | 0.4310 (1) | 0.3658 (1) | 2.75 | 1.7030 (1) | 1.1123 (9) | 3.0189 (23) | 5.3053 (11) | 12 | Model | Preprint |
| 2 | IKIM | 8.4062 | 0.6043 (16) | 0.5828 (7) | 0.7938 (3) | 0.6176 (4) | 7.5 | 2.7249 (3) | 8.4799 (2) | 1.0422 (8) | 0.7334 (7) | 5.125 | 4.9373 (17) | 1.4709 (14) | 2.6586 (19) | 3.1085 (4) | 13.5 | Model | Preprint |
| 3 | HussainAlasmawi | 8.4375 | 0.6370 (6) | 0.5725 (10) | 0.7802 (5) | 0.5854 (7) | 7.0 | 2.4542 (2) | 10.1997 (9) | 0.6365 (2) | 0.6265 (4) | 4.25 | 3.3616 (13) | 1.7221 (18) | 2.8756 (22) | 5.2173 (9) | 15.5 | Model | Preprint |
| 4 | StockholmTrio | 9.9375 | 0.5771 (21) | 0.6010 (4) | 0.7684 (8) | 0.6326 (3) | 9.0 | 8.4921 (11) | 11.1818 (19) | 1.1839 (12) | 0.8581 (11) | 13.25 | 1.9526 (9) | 0.8850 (6) | 1.7990 (12) | 3.8848 (7) | 8.5 | Model | Preprint |
| 5 | UIH_CRI_SIL | 10.0625 | 0.6194 (14) | 0.5937 (5) | 0.7922 (4) | 0.4111 (18) | 10.25 | 4.6745 (6) | 7.5758 (1) | 0.9560 (7) | 0.4422 (2) | 4.0000 | 1.9500 (8) | 2.0641 (21) | 2.2770 (15) | 12.4480 (19) | 15.75 | Model | Preprint |
| 6 | AiraMatrix | 11.0625 | 0.6253 (11) | 0.5273 (20) | 0.7556 (10) | 0.6600 (2) | 10.75 | 12.5127 (17) | 15.6801 (28) | 1.6105 (16) | 1.0412 (16) | 19.25 | 1.8776 (6) | 0.4382 (1) | 0.8604 (5) | 1.7253 (2) | 3.5 | Model | Preprint |
| 7 | Lennonlychan | 11.625 | 0.6286 (9) | 0.5302 (18) | 0.7454 (13) | 0.4775 (10) | 12.5 | 12.5980 (18) | 10.5936 (11) | 1.1815 (11) | 0.8377 (10) | 12.5 | 1.8980 (7) | 1.0702 (8) | 1.2379 (7) | 5.9060 (14) | 9.0 | Model | Preprint |
| 8 | QuantIF | 11.6875 | 0.5800 (20) | 0.5470 (13) | 0.7649 (9) | 0.6024 (6) | 12.0 | 6.7282 (8) | 11.7130 (20) | 2.2904 (20) | 0.8140 (8) | 14.0 | 10.0465 (23) | 0.6253 (3) | 0.7074 (1) | 4.2608 (8) | 8.75 | Model | Preprint |
| 9 | Shadab | 12.0625 | 0.6159 (15) | 0.5794 (9) | 0.7270 (16) | 0.4540 (13) | 13.25 | 11.4725 (15) | 9.9943 (7) | 0.7998 (6) | 0.6623 (5) | 8.25 | 2.1096 (10) | 1.4117 (13) | 1.9246 (14) | 7.0941 (17) | 13.5 | Model | Preprint |
| 10 | Zero_sugar | 13.25 | 0.6580 (4) | 0.5446 (14) | 0.7373 (15) | 0.4271 (17) | 12.5 | 12.3233 (16) | 11.0423 (17) | 4.3788 (25) | 1.6138 (22) | 20.0000 | 0.5802 (2) | 1.3717 (11) | 0.8209 (4) | 6.3086 (15) | 8.0 | Model | Preprint |
| 11 | BAMF | 13.3125 | 0.6666 (1) | 0.5299 (19) | 0.6973 (22) | 0.4672 (11) | 13.25 | 11.3668 (14) | 14.7570 (26) | 1.4420 (15) | 2.3205 (26) | 20.25 | 3.1945 (11) | 0.6220 (2) | 1.7017 (10) | 2.2677 (3) | 6.5 | Model | Preprint |
| datacentric baseline | 15.3125 | 0.6362 (7) | 0.5252 (22) | 0.7254 (18) | 0.4397 (15) | 15.5 | 15.6634 (21) | 11.0583 (18) | 5.0262 (26) | 1.0951 (17) | 20.5 | 0.3659 (1) | 1.9186 (19) | 0.9542 (6) | 5.7609 (13) | 9.75 | Model | Preprint | |
| 12 | DING1122 | 18.75 | 0.6281 (10) | 0.5390 (15) | 0.7267 (17) | 0.1062 (27) | 17.25 | 14.0621 (19) | 10.8470 (15) | 1.3436 (14) | 2.0637 (23) | 17.75 | 11.2634 (25) | 2.5160 (23) | 2.3319 (16) | 127.1480 (27) | 22.75 | Model | Preprint |
| 13 | WukongRT | 18.875 | 0.6204 (13) | 0.5206 (23) | 0.7221 (19) | 0.3386 (22) | 19.25 | 9.3683 (12) | 11.7982 (21) | 1.1040 (10) | 1.0006 (15) | 14.5 | 6.7212 (20) | 3.3785 (25) | 3.5422 (24) | 18.7775 (21) | 22.5 | Model | Preprint |
| 14 | HKURad | 19.375 | 0.6026 (17) | 0.4955 (25) | 0.6973 (21) | 0.3496 (21) | 21.0 | 10.8671 (13) | 12.9096 (24) | 3.3258 (21) | 1.1034 (18) | 19.0 | 4.8969 (16) | 1.3913 (12) | 2.6552 (18) | 13.1626 (20) | 16.5 | Model | Preprint |
| 15 | max.sh | 19.5312 | 0.4012 (26) | 0.5811 (8) | 0.7483 (12) | 0.0285 (29) | 18.5 | 30.2820 (27) | 9.2688 (3) | 0.6570 (4) | 2.1117 (25) | 14.5 | 924.3099 (28) | 3.0797 (24) | 3.8532 (26) | 924.3099 (29) | 26.625 | Model | Preprint |
| 16 | Shrajanbhandary | 21.75 | 0.2669 (29) | 0.6125 (3) | 0.1875 (29) | 0.3597 (20) | 20.2500 | 32.2533 (28) | 9.4384 (4) | 54.5663 (29) | 2.3478 (27) | 22.0 | 5.4561 (18) | 8429 (29) | 13538 (29) | 24.7666 (22) | 24.5 | Model | Preprint |
| nnunet baseline | 24.0 | 0.5017 (24) | 0.4741 (27) | 0.6822 (25) | 0.1512 (26) | 25.5 | 14.0836 (20) | 12.5885 (23) | 1.6795 (17) | 0.9905 (14) | 18.5000 | 11.7733 (26) | 4.9485 (27) | 6.6433 (27) | 102.6461 (26) | 26.5 | Model | ||
| 17 | TUM_ibbm | 26.25 | 0.2845 (28) | 0.2031 (29) | 0.3639 (28) | 0.1891 (25) | 27.5 | 3.6257 (5) | 28.4085 (29) | 9.4993 (27) | 3.4622 (29) | 22.5000 | 231.9891 (29) | 216.4435 (28) | 250.7309 (28) | 89.9235 (25) | 27.5 | Model | Preprint |
Category 2: Datacentric
| # | Team | Mean Position | Dice (Position) | False Negative Volume (Position) | False Positive Volume (Position) | Model | Documentation | ||||||||||||
|---|---|---|---|---|---|---|---|---|---|---|---|---|---|---|---|---|---|---|---|
| LMU FDG | LMU PSMA | UKT FDG | UKT PSMA | Overall rank | LMU FDG | LMU PSMA | UKT FDG | UKT PSMA | Overall rank | LMU FDG | LMU PSMA | UKT FDG | UKT PSMA | Overall rank | |||||
| 1 | Lennonlychan | 2.5625 | 0.6286 (5) | 0.5302 (3) | 0.7454 (1) | 0.4775 (1) | 2.5 | 12.5980 (2) | 10.5936 (2) | 1.1815 (1) | 0.8377 (2) | 1.75 | 1.8980 (5) | 1.0702 (1) | 1.2379 (4) | 5.9060 (4) | 3.5 | Model | Preprint |
| 2 | Zero_sugar | 3.125 | 0.6580 (1) | 0.5446 (1) | 0.7373 (3) | 0.4271 (5) | 2.5 | 12.3233 (1) | 11.0423 (5) | 4.3788 (5) | 1.6138 (7) | 4.5 | 0.5802 (2) | 1.3717 (3) | 0.8209 (2) | 6.3086 (5) | 3.0 | Model | Preprint |
| datacentric baseline | 4.0 | 0.6362 (3) | 0.5252 (5) | 0.7254 (4) | 0.4397 (4) | 4.0 | 15.6634 (3) | 11.0583 (6) | 5.0262 (6) | 1.0951 (4) | 4.75 | 0.3659 (1) | 1.9186 (6) | 0.9542 (3) | 5.7609 (3) | 3.25 | Model | ||
| 3 | LesionTracer | 5.8125 | 0.6218 (6) | 0.4466 (7) | 0.6110 (7) | 0.3611 (6) | 6.5 | 21.4829 (6) | 14.7929 (7) | 19.6584 (7) | 1.2459 (5) | 6.25 | 0.7751 (3) | 1.1609 (2) | 1.7559 (5) | 10.6363 (6) | 4.0 | Model | Preprint |
| 4 | UIH_CRI_SIL | 5.8125 | 0.4298 (7) | 0.4925 (6) | 0.6469 (6) | 0.2903 (7) | 6.5 | 23.3383 (7) | 9.5916 (1) | 4.3688 (4) | 0.5800 (1) | 3.25 | 8.6082 (7) | 4.5019 (7) | 2.7256 (7) | 30.6340 (7) | 7.0 | Model | Preprint |
Organizers

- Clemens Cyran
- Michael Ingrisch
- Jakob Dexl
- Katharina Jeblick
- Balthasar Schachtner
- Andreas Mittermeier
- Anna Theresa Stüber


Medical Image and Data Analysis (MIDAS.lab)