autoPET-IV
The human frontier
Introduction
We invite you to participate in the fourth autoPET Challenge. The focus of this year's challenge is to explore the an interactive human-in-the-loop scenario for lesion segmentation in whole-body PET/CT and longitudinal CT. Positron Emission Tomography / Computed Tomography (PET/CT) and CT are an integral part of the diagnostic workup for various malignant solid tumor entities. Currently, response assessment for cancer treatment is performed by radiologists (i.e. human observers) on consecutive PET/CT or CT scans through the detection of changes in tumour size and distribution using standardised criteria. Despite the highly time-consuming nature of this manual task, only unidimensional (diameter) evaluations of a subset of tumour lesions are used to assess tumour dynamics. Additional quantitative evaluation of PET information would potentially allow for more precise and individualized diagnostic decisions. Besides the risk of inter-observer variability, the manual approach only extracts a diminutive proportion of the morphologic tumour data derived from images, thereby neglecting valuable, significant, and prognostic information. Automation of tumour detection and segmentation as well as longitudinal evaluation may enable faster and more comprehensive information and data extraction. However, automated solutions for this task are lacking. AI-based approaches, using deep-learning models, may be an appropriate way to address lesion detection and segmentation in whole-body hybrid imaging (PET/CT and CT) to compensate workload and time pressure during radiological readings. So far, most AI solutions analyse isolated scans at single time points, and/or from a single imaging modality and thus information from preliminary or additional examinations is excluded. Moreover, methods are often prone to specialize to specific imaging conditions (imaging scanner, lesion phenotype, PET tracer, and so on) rendering it a challenge to generalize for different imaging scenarios. In addition, the necessity or potential benefit of integrating human experts in the training and/or inference loop is not yet explored in this setting. Join us in autoPET IV to explore the role of human annotations in segmenting and tracking lesions for PET/CT and CT imaging. Algorithms are provided with varying levels of annotations with the aim to investigate the model conditioning on label information. To this end, we provide a third, large longitudinal CT training dataset of melanoma patients under therapy. We allow the submission of data-centric solutions (using the provided baselines), integration and interaction with foundation models, using/extending pre-trained algorithms, or the developments of novel algorithms.
AutoPET/CT-IV is hosted at the MICCAI 2025: ![]()
and supported by the European Society for hybrid, molecular and translational imaging (ESHI). The challenge is the successor of autoPET, autoPET II, and autoPET III.
Grand Challenge
More information about the challenge can be found on Grand Challenge.Task
The tasks will handle lesion segmentation for whole-body hybrid imaging for a single-staging PET/CT (Task 1) or a longitudinal CT screening (Task 2). All public available data and (pre-trained) models (including foundation models) are allowed. Time points and/or imaging modality inputs can be treated individually or jointly. Participants can either develop a
- novel method and/or
- focus on data-centric approaches (using the provided baselines), i.e. development on pre- and post-processing pipelines.
🎯 Goal
The aim is to develop a) accurate and b) robust lesion segmentation methods that work under varying levels of human-annotated information in either single-staging whole-body PET/CT (Task 1) or a longitudinal CT screening (Task 2).
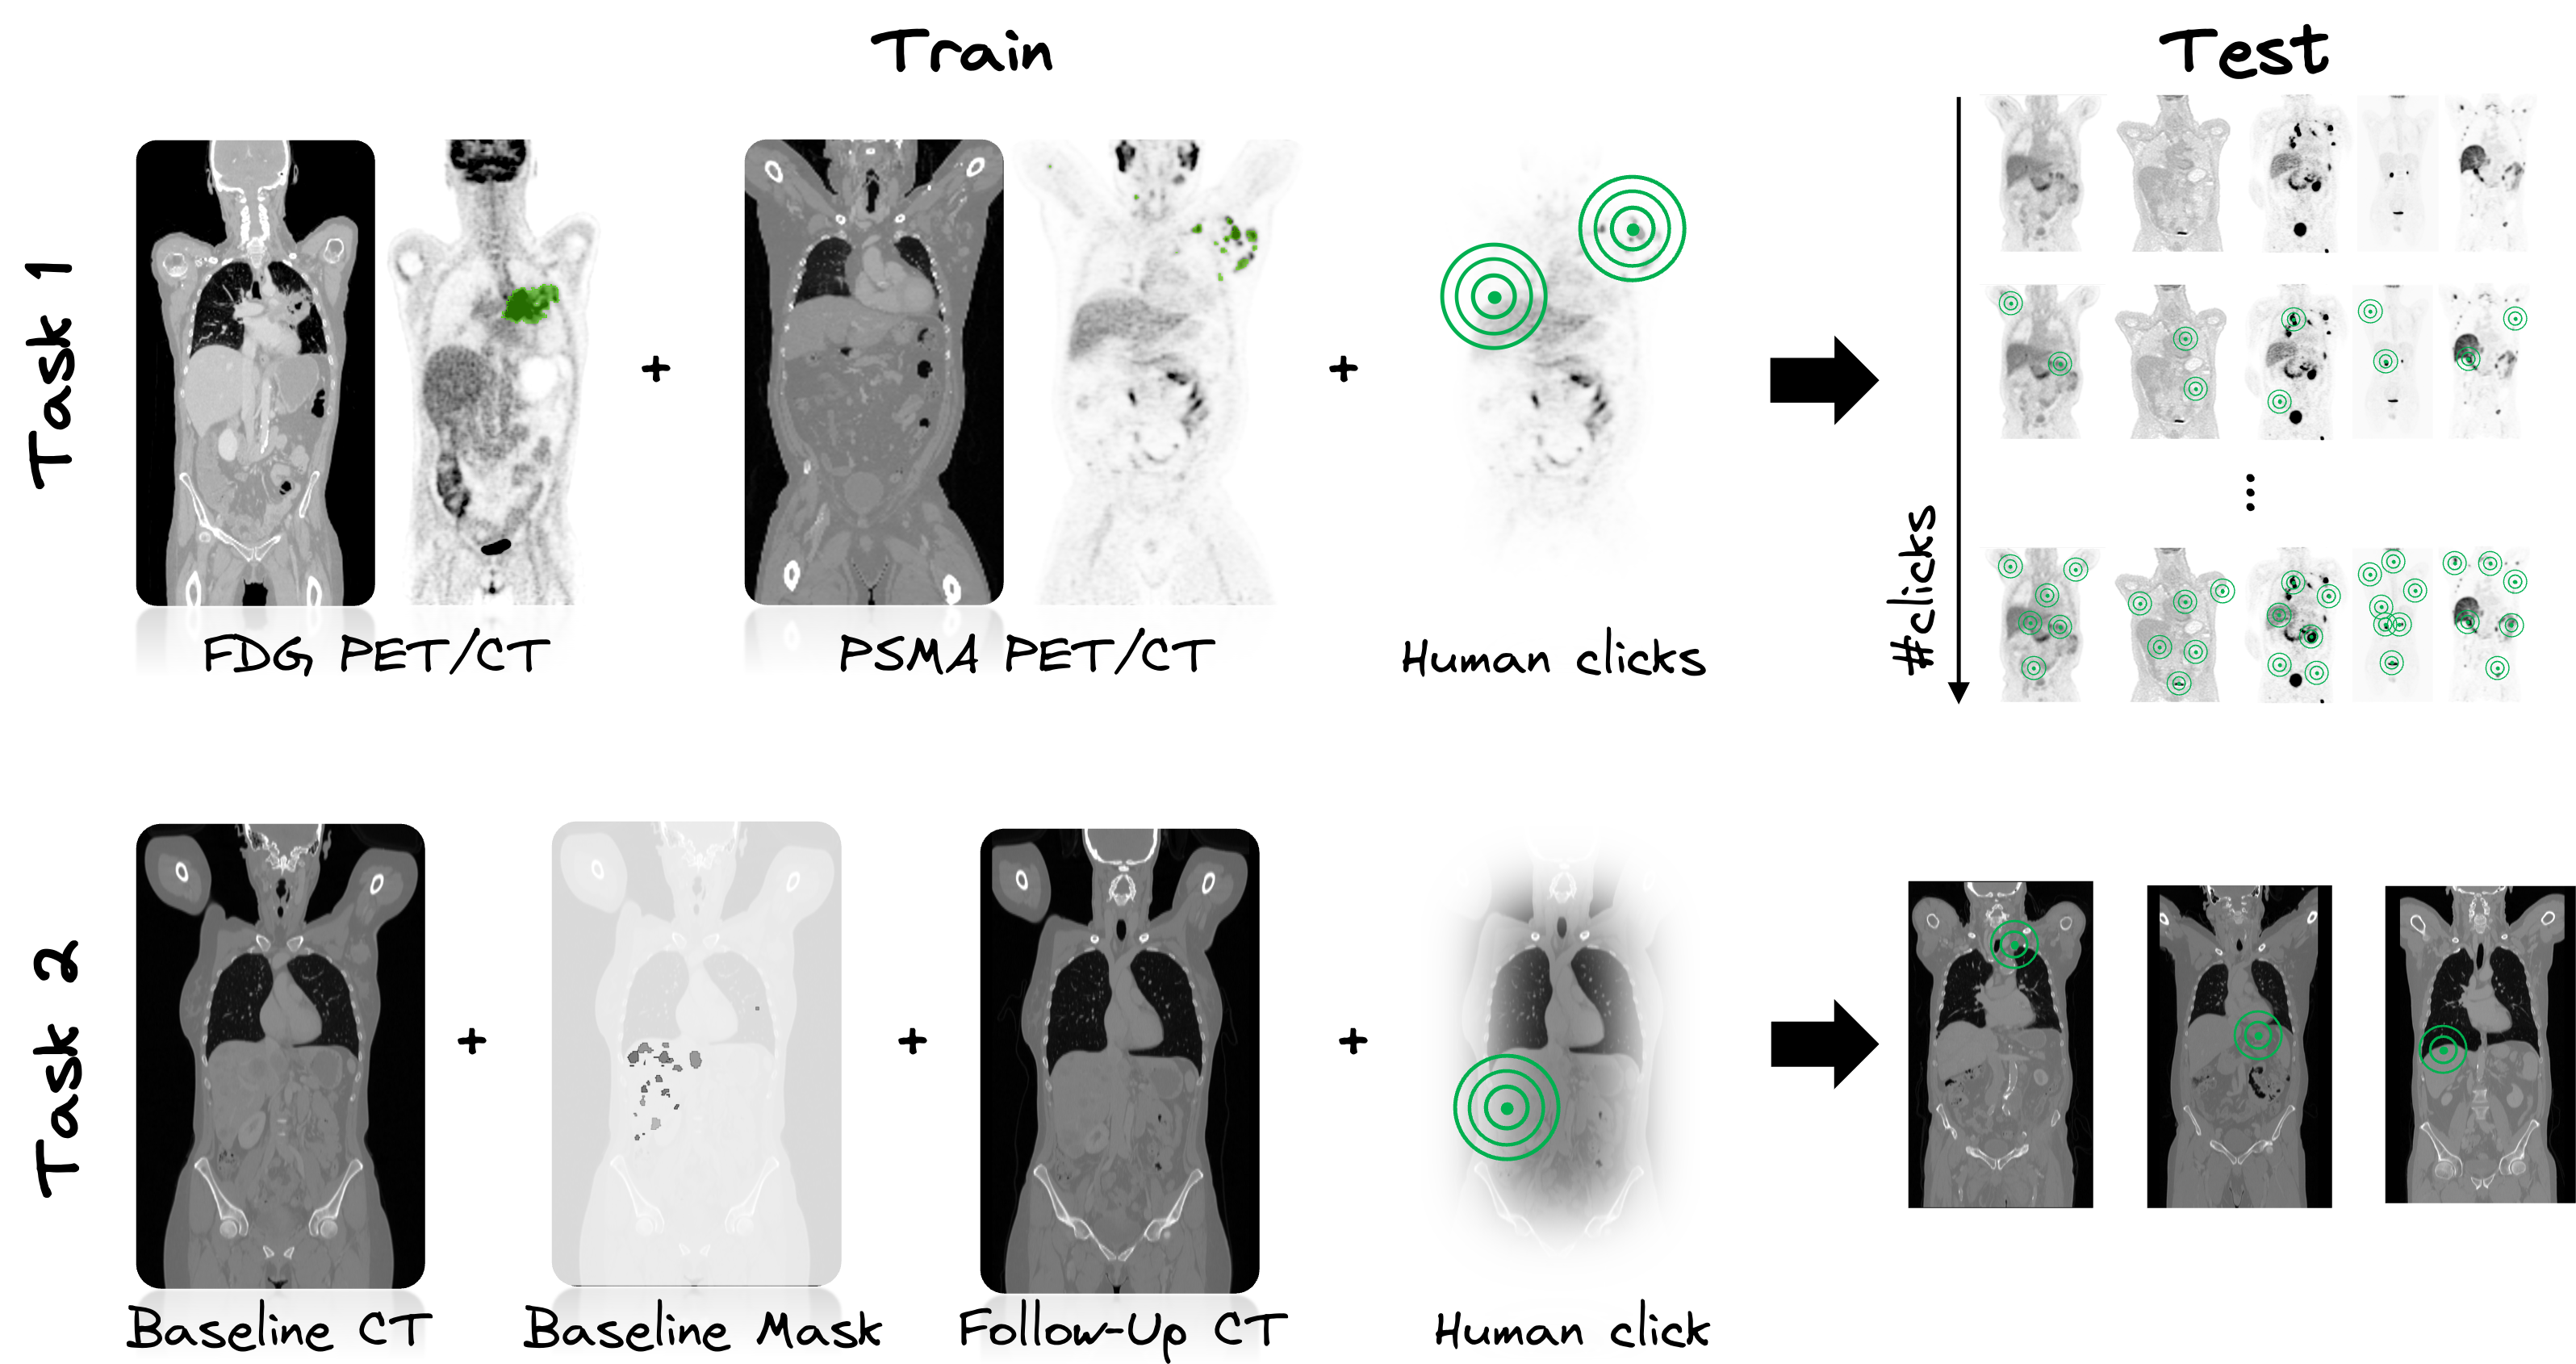
Task 1: Single-staging whole-body PET/CT
In Task 1, we study an interactive human-in-the-loop segmentation scenario and investigate the impact of varying degrees of label information (none to multiple clicks per lesion and background) on the segmentation performance in a multi-tracer and multi-center imaging setting - similar to the previous iterations of the autoPET challenge. The specific challenge in automated segmentation of lesions in PET/CT is to avoid false-positive segmentation of anatomical structures that have physiologically high uptake while capturing all tumor lesions. This task is particularly challenging in a multitracer setting since the physiological uptake partly differs for different tracers: e.g. brain, kidney, heart for FDG and e.g. liver, kidney, spleen, submandibular for PSMA. We will study the behaviour over 11 interactive segmentation steps. In each step, an additional standardized and pre-simulated tumor (foreground) and background click, represented as a set of 3D coordinates, will be provided alongside the input image. This process will progress incrementally from 0 clicks (1st step) to the full allocation of 10 tumor and 10 background clicks per image (11th step).
Task 2: Longitudinal CT screening
In Task 2, we explore the performance of lesion segmentation in a follow-up scenario with additional information from a previous CT scan. More precisely, the CT images of the baseline and follow-up scan are provided together with the baseline segmentation mask, the lesion centers in the baseline images and the propagated lesion centers in the follow-up images. We investigate the segmentation performance in a novel longitudinal whole-body CT database of >300 cases - similar to autoPET I. A specific challenge lies in the high variability of lesion spread. The tumors can change shape (progression or regression), split or merge, disappear (complete response) or newly appear (metastasis). In addition, in some cases the differentiation between malignant and benign tissue can be difficult. We aim to investigate to what extent the findings from a previous time point facilitate the task of lesion segmentation in the follow-up. The CT images of the baseline and follow-up scan are provided together with the baseline segmentation mask (for tumor localization). An additional pre-simulated tumor click in the baseline and follow-up CT scan are provided. We encourage the usage of registration algorithms to better align the baseline and follow-up CT images, i.e. to transform the baseline lesion (from baseline segmentation) into the follow-up CT scan and target region, but this is not mandatory. The click is represented as a set of 3D coordinates on the follow-up CT image.
Database
Task 1: Single-staging whole-body PET/CT
ℹ️ Information
The FDG cohort comprises 1014 studies of 501 patients diagnosed with histologically proven malignant melanoma, lymphoma, or lung cancer, along with 513 negative control patients. The PSMA cohort includes pre- and/or post-therapeutic PET/CT images of male individuals with prostate carcinoma, encompassing images with (537) and without PSMA-avid tumor lesions (60). Notably, the training datasets exhibit distinct age distributions: the FDG UKT cohort spans 570 male patients (mean age: 60; std: 16) and 444 female patients (mean age: 58; std: 16), whereas the PSMA MUC cohort tends to be older, with 378 male patients (mean age: 71; std: 8). Additionally, there are variations in imaging conditions between the FDG UKT and PSMA MUC cohorts, particularly regarding the types and number of PET/CT scanners utilized for acquisition. The PSMA MUC dataset was acquired using three different scanner types (Siemens Biograph 64-4R TruePoint, Siemens Biograph mCT Flow 20, and GE Discovery 690), whereas the FDG UKT dataset was acquired using a single scanner (Siemens Biograph mCT).
📥 Download
We provide the merged data as NIfTI in nnUNet format which can be downloaded from fdat (120GB):
The download will contain the resampled FDG and PSMA data as NiFTI files. It also contains the files obtained by running the nnUNet fingerprint extractor and a splits file which we use to design/train our baselines.
🎥 PET/CT acquisition protocol
FDG dataset: Patients fasted at least 6 h prior to the injection of approximately 350 MBq 18F-FDG. Whole-body PET/CT images were acquired using a Biograph mCT PET/CT scanner (Siemens, Healthcare GmbH, Erlangen, Germany) and were initiated approximately 60 min after intravenous tracer administration. Diagnostic CT scans of the neck, thorax, abdomen, and pelvis (200 reference mAs; 120 kV) were acquired 90 sec after intravenous injection of a contrast agent (90-120 ml Ultravist 370, Bayer AG) or without contrast agent (in case of existing contraindications). PET Images were reconstructed iteratively (three iterations, 21 subsets) with Gaussian post-reconstruction smoothing (2 mm full width at half-maximum). Slice thickness on contrast-enhanced CT was 2 or 3 mm.
PSMA dataset: Examinations were acquired on different PET/CT scanners (Siemens Biograph 64-4R TruePoint, Siemens Biograph mCT Flow 20, and GE Discovery 690). The imaging protocol mainly consisted of a diagnostic CT scan from the skull base to the mid-thigh using the following scan parameters: reference tube current exposure time product of 143 mAs (mean); tube voltage of 100kV or 120 kV for most cases, slice thickness of 3 mm for Biograph 64 and Biograph mCT, and 2.5 mm for GE Discovery 690 (except for 3 cases with 5 mm). Intravenous contrast enhancement was used in most studies (571), except for patients with contraindications (26). The whole-body PSMA-PET scan was acquired on average around 74 minutes after intravenous injection of 246 MBq 18F-PSMA (mean, 369 studies) or 214 MBq 68Ga-PSMA (mean, 228 studies), respectively. The PET data was reconstructed with attenuation correction derived from corresponding CT data. For GE Discovery 690 the reconstruction process employed a VPFX algorithm with voxel size 2.73 mm × 2.73 mm × 3.27 mm, for Siemens Biograph mCT Flow 20 a PSF+TOF algorithm (2 iterations, 21 subsets) with voxel size 4.07 mm × 4.07 mm × 3.00 mm, and for Siemens Biograph 64-4R TruePoint a PSF algorithm (3 iterations, 21 subsets) with voxel size 4.07 mm × 4.07 mm × 5.00 mm.
⌛ Training and test cohort
Training cases: 1,014 FDG studies (900 patients) and 597 PSMA studies (378 patients)
Test cases (final evaluation): 200 studies (50 FDG LMU, 50 FDG UKT, 50 PSMA LMU, 50 PSMA UKT)
Test cases (preliminary evaluation): 5 studies
A case (training or test) consists of one 3D whole body FDG-PET volume, one corresponding 3D whole body CT volume, one 3D binary mask of manually segmented tumor lesions on FDG-PET of the size of the PET volume, and a simulated human click. CT and PET were acquired simultaneously on a single PET/CT scanner in one session; thus PET and CT are anatomically aligned up to minor shifts due to physiological motion. A pre-rocessing script for resampling the PET and CT to the same matrix size will be provided. In addition, the human interaction in the form of a foreground (lesion) and background click are pre-simulated (for training and test). The pre-simulated clicks for training are provided in Github together with a script for further (parametrized) click simulations.
Training set
FDG training data consists of 1,014 studies acquired at the University Hospital Tübingen and is made publicly available on TCIA in DICOM format:
and on fdat in NIfTI format:
PSMA training data consists of 597 studies acquired the LMU University Hospital Munich and will be made publicly available on TCIA in DICOM format. The combined PSMA and FDG data is available on fdat in NIfTI format:
If you use this data, please cite:
Gatidis S, Kuestner T. A whole-body FDG-PET/CT dataset with manually annotated tumor lesions (FDG-PET-CT-Lesions) [Dataset]. The Cancer Imaging Archive, 2022. DOI: 10.7937/gkr0-xv29
Jeblick, K., et al. A whole-body PSMA-PET/CT dataset with manually annotated tumor lesions (PSMA-PET-CT-Lesions) (Version 1) [Dataset]. The Cancer Imaging Archive, 2024. DOI: 10.7937/r7ep-3x37
Preliminary test set
For the self-evaluation of participating pipelines, we provide access to a preliminary test set. The preliminary test set does not reflect the final test set. Algorithm optimization on the preliminary test set will not yield satisfactory results on the final test set! The access to this preliminary set is restricted and only possible through the docker containers submitted to the challenge, and only available for a limited time during the competition. The purpose of this is that participants can check the implementation and sanity of their approaches.
Final test set
The final test set consists of 200 studies, containing 50 FDG LMU, 50 FDG UKT, 50 PSMA LMU, 50 PSMA UKT studies. We will not disclose further details of test data as we aim to avoid fine-tuning of algorithms to the test data domain.
🗃️ Data structure
|--- imagesTr
     |--- tracer_patient1_study1_0000.nii.gz  (CT image resampled to PET)
     |--- tracer_patient1_study1_0001.nii.gz  (PET image in SUV)
     |--- ...
|--- labelsTr
     |--- tracer_patient1_study1.nii.gz       (manual annotations of tumor lesions)

|--- dataset.json                             (nnUNet dataset description)
|--- dataset_fingerprint.json                 (nnUNet dataset fingerprint)

|--- splits_final.json                        (reference 5fold split)

|--- psma_metadata.csv                        (metadata csv for psma)

|--- fdg_metadata.csv                         (original metadata csv for fdg)
⚙️ Data pre-processing
Please note, that the submission and evaluation interfaces provided by grand-challenge are working with .mha data. Hence, you will need to read the test images in your submission from an .mha file. We already provide interfaces and code for this in the baseline algorithms.
✒ Annotation
FDG PET/CT training and test data from UKT was annotated by a Radiologist with 10 years of experience in Hybrid Imaging and experience in machine learning research. FDG PET/CT test data from LMU was annotated by a radiologist with 8 years of experience in hybrid imaging. PSMA PET/CT training and test data from LMU as well as PSMA PET/CT test data from UKT was annotated by a single reader and reviewed by a radiologist with 5 years of experience in hybrid imaging.
The following annotation protocol was defined:
Step 1: Identification of tracer-avid tumor lesions by visual assessment of PET and CT information together with the clinical examination reports.
Step 2: Manual free-hand segmentation of identified lesions in axial slices.
Task 2: Longitudinal CT screening
ℹ️ Information
The cohort consists of melanoma patients undergoing longitudinal CT screening examinations in an oncologic context for diagnosis, staging, or therapy response assessment. The CT cohort comprises whole-body imaging in >300 patients (female: 170, mean age: 64y, std age: 15y) of two imaging timepoints: baseline staging, and follow-up scans after therapy treatment. Training data was acquired at a single site (UKT).
📥 Download
Database release starting soon.
🎥 CT acquisition protocol
Patients were scanned with the inhouse whole-body staging protocol for a scan field from skull base to the middle of the femur with patients laid in a supine position, arms raised above the head. Scanning was performed during the portal-venous phase after administration of body-weight adapted contrast medium through the cubital vein. Attenuation-based tube current modulation (CARE Dose, reference mAs 240) and tube voltage (120 kV) were applied. The following scan parameters were used:
SOMATOM Force: collimation 128 × 0.6 mm, rotation time 0.5 s, pitch 0.6
Sensation64: collimation 64 × 0.6 mm, rotation time 0.5 s, pitch 0.6
SOMATOM Definition Flash: collimation 128 × 0.6 mm, rotation time 0.5 s, pitch 1.0
SOMATOM Definition AS: collimation 64 × 0.6 mm, rotation time 0.5 s, pitch 0.6
Biograph128: collimation 128 × 0.6 mm, rotation time 0.5 s, pitch 0.8
Slice thickness as well as increment were set to 3 mm. A medium smooth kernel was used for image reconstruction.
⌛ Training and test cohort
Training cases: >300 studies (>300 patients)
Test cases (final evaluation): 140 studies (70 UKT, 70 UM Mainz)
Test cases (preliminary evaluation): 5 studies
A case (training or test) consists of one 3D CT volume, and one 3D binary mask of manually segmented tumor lesions on the CT volume, in two imaging sessions/time points: baseline and follow-up after therapy treatment. The human interaction in the form of a center lesion click in the follow-up scan is pre-simulated. The pre-simulated clicks for training are provided in Github together with a script for further (parametrized) click simulations.
Training set
Annotated longitudinal CT of two imaging time points in >300 studes was acquired at the University Hospital Tübingen and is made publicly available on fdat in NIfTI format: TBD
Preliminary test set
For the self-evaluation of participating pipelines, we provide access to a preliminary test set. The preliminary test set does not reflect the final test set. Algorithm optimization on the preliminary test set will not yield satisfactory results on the final test set!
The access to this preliminary set is restricted and only possible through the docker containers submitted to the challenge, and only available for a limited time during the competition. The purpose of this is that participants can check the implementation and sanity of their approaches.
Final test set
Test data will be drawn in part (50%) from the same sources and distributions as the training data. The other part will be drawn from another center: University Hospital Mainz (50%). At this moment we will not disclose details of the test data as we aim to avoid fine-tuning of algorithms to the test data domain. The distribution of test data will be made public after the challenge deadline.
🗃️ Data structure
⚙️ Data pre-processing
Please note, that the submission and evaluation interfaces provided by grand-challenge are working with .mha data. Hence, you will need to read the test images in your submission from an .mha file. We already provide interfaces and code for this in the baseline algorithms.
✒ Annotation
All data were manually annotated by two experienced radiologists. To this end, tumor lesions were manually segmented on the CT image data using dedicated software.
The following annotation protocol was defined:
Step 1: Identification of tumor lesions by visual assessment of CT information together with the clinical examination reports.
Step 2: Manual free-hand segmentation of identified lesions in axial slices.
Step 3: Baseline and follow-up segmentations are viewed side-by-side to mark the matching lesions.
Evaluation
Evaluation will be performed on held-out test cases. For evaluation, a combination of six metrics will be used, reflecting the aims and specific challenges of PET/CT lesion detection and segmentation, and that are formed of three basic measures:
- Foreground Dice score (DSC) of segmented lesions
- False positive volume (FPV): Volume of false positive connected components that do not overlap with positives
- False negative volume (FNV): Volume of positive connected components in the ground truth that do not overlap with the estimated segmentation mask
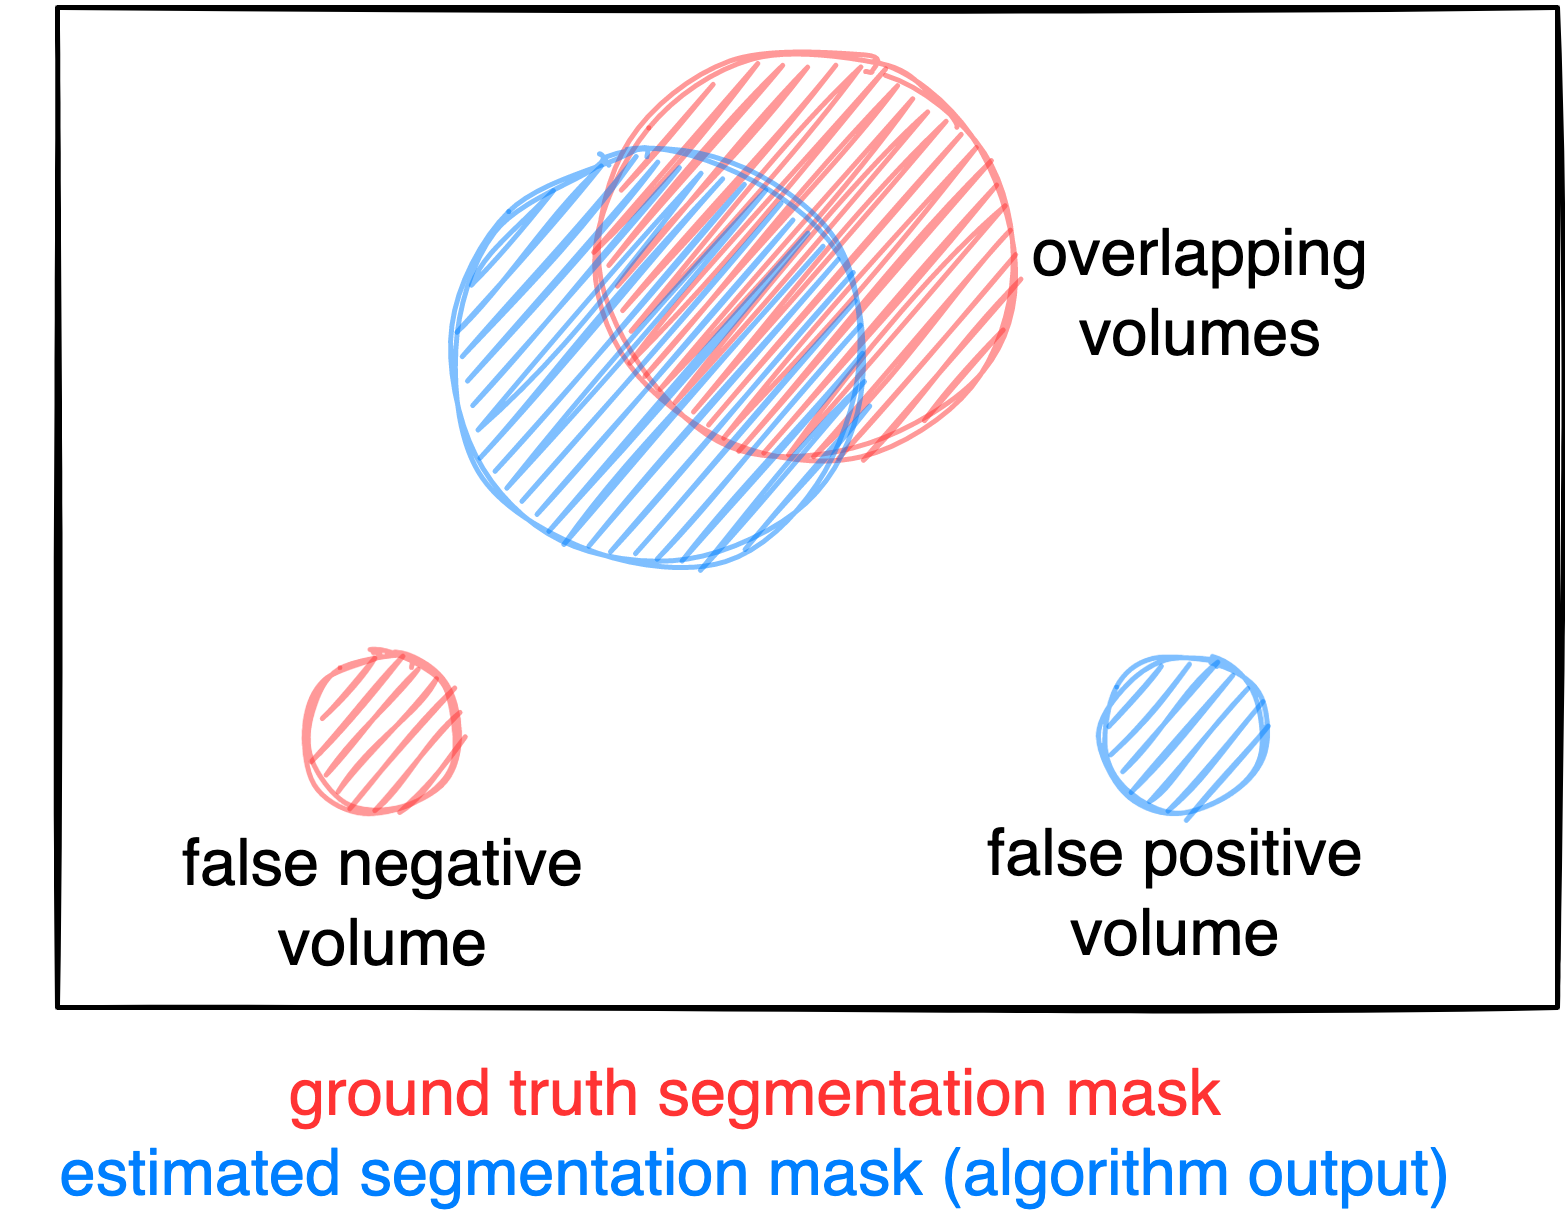
Figure: Example for the evaluation. The Dice score is calculated to measure the correct overlap between predicted lesion segmentation (blue) and ground truth (red). Additionally special emphasis is put on false negatives by measuring their volume (i.e. entirely missed lesions) and on false positives by measuring their volume (i.e. large false positive volumes like brain or bladder will result in a low score).
Task 1: Single-staging whole-body PET/CT
For Task 1, we will evaluate the following metrics:
- DSC @last: Interaction Efficacy of DSC at last interactive segmentation step
- FPV @last: Interaction Efficacy of FPV at last interactive segmentation step
- FNV @last: Interaction Efficacy of FNV at last interactive segmentation step
- AUC-DSC: Interaction Utilization as Area under the curve for DSC
- AUC-FPV: Interaction Utilization as Area under the curve for FPV
- AUC-FNV: Interaction Utilization as Area under the curve for FNV
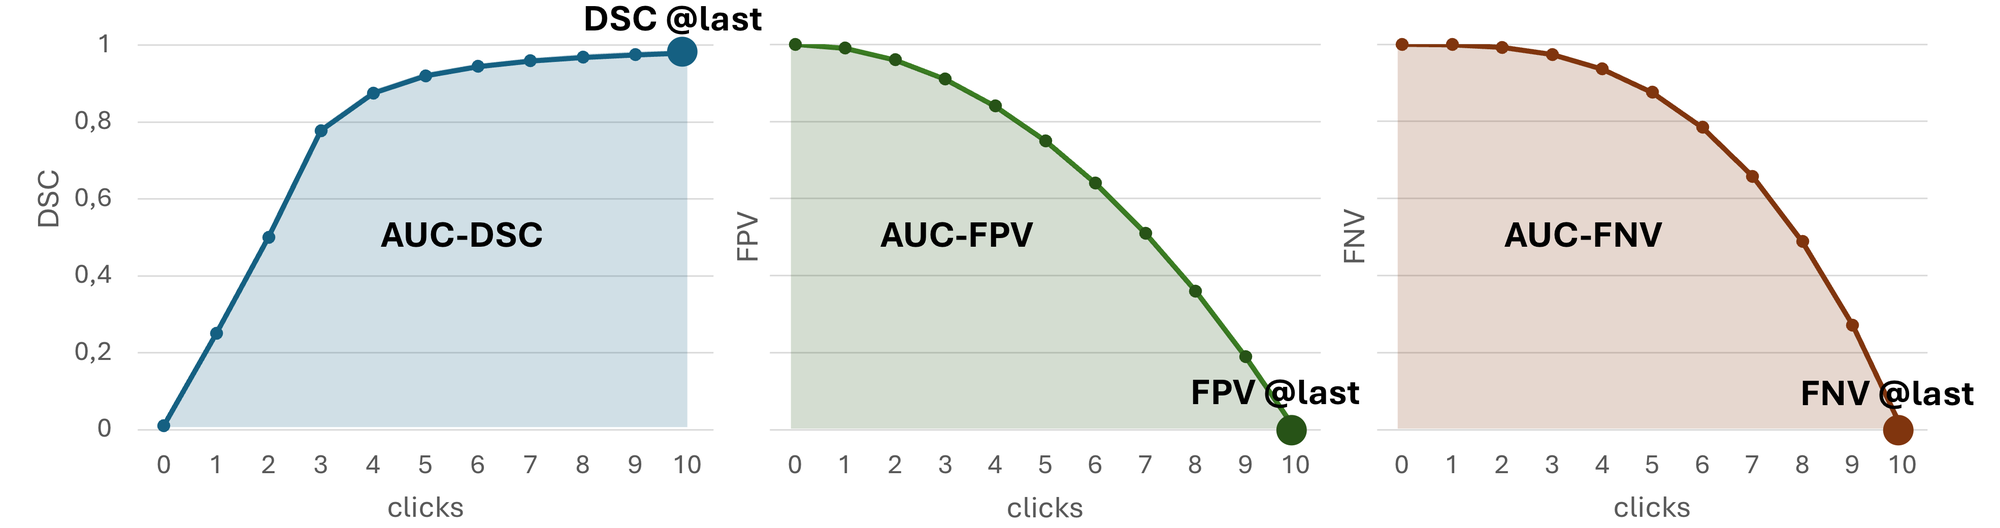
Metrics 1-3 assess the final segmentation quality achieved after incorporating all clicks in the last (11th) interactive segmentation iteration. It reflects the performance of the model in producing accurate annotations after completing the full interaction process.
Metrics 4-6 evaluate the AUC for DSC, FPV, and FNV based on the model’s intermediate predictions after each interactive segmentation step. The AUC is calculated using the trapezoidal rule, where the x-axis represents the interactive segmentation step (0 to 10) and the y-axis represents the corresponding metric value at each step. This metric quantifies how efficiently a model utilizes the additional information in the form of clicks to achieve a clinically relevant segmentation, measuring how quickly accurate annotations are produced as user clicks are incrementally added.
In case of test data that do not contain positives (no lesions), only metric 2 will be used. For such volumes without tumors, we will also only provide background clicks for all interaction steps.
Task 2: Longitudinal CT screening
For Task 2, we will evaluate the following metrics:
- DSC @last: Interaction Efficacy of DSC with given lesion center in follow-up scan
- FPV @last: Interaction Efficacy of FPV with given lesion center in follow-up scan
- FNV @last: Interaction Efficacy of FNV with given lesion center in follow-up scan
In case of test data that do not contain positives (no lesions), only metric 2 will be used.
Ranking
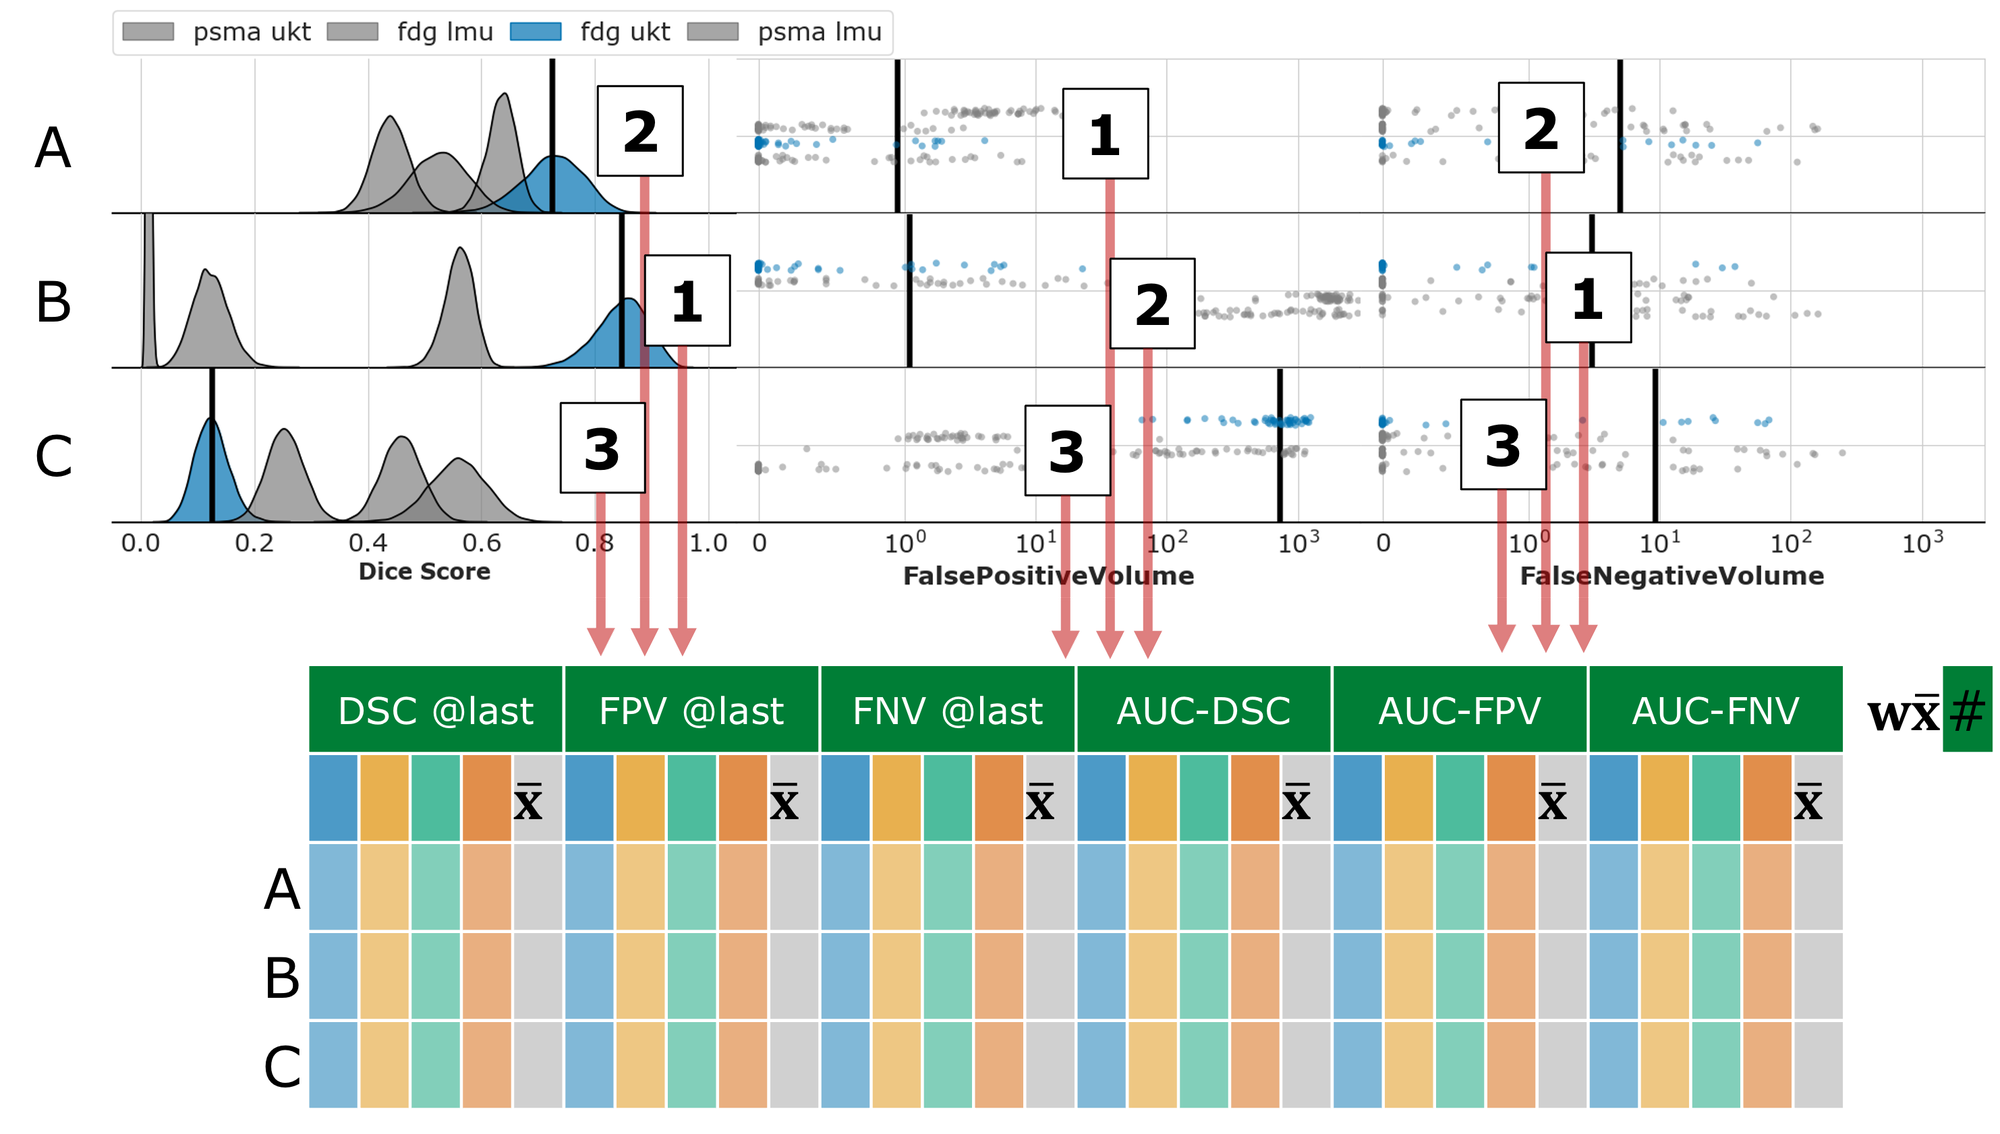
Task 1: Single-staging whole-body PET/CT
We divide the test dataset into subsets based on center and tracer (i.e., PSMA LMU, PSMA UKT, FDG LMU, FDG UKT) and calculated the average metrics for Interaction Efficacy (DSC @last, FPV @last, FNV @last) and the Interaction Utilization (AUC-DSC: higher = better, AUC-FPV: lower = better, AUC-FNV: lower = better) within each subset. Then, we average the subset averages. For each of the six metrics, we compute the rank over all submissions. Finally, we generated the overall rank by combining the six metric ranks using a weighting factor: DSC @last (0.25), FPV @last (0.125), FNV @last (0.125), AUC-DSC (0.25), AUC-FPV (0.125), AUC-FNV (0.125).
Task 2: Longitudinal CT screening
For each test case, we will compute the average metrics for Interaction Efficacy (DSC @last: higher = better, FPV @last: lower = better, FNV @last: lower = better) with provided center lesion click, producing three averaged metrics per submission. Then, we compute seperate rankings for each of the three averaged metrics. Finally, we generated the overall rank by combining the three metric ranks using a weighting factor: DSC @last (0.5), FPV @last (0.25), FNV @last (0.25).
Codes and Models
Codes
https://github.com/lab-midas/autoPETCTIV
Models
Models and documentation of the submitted challenge algorithms can be found in the Leaderboard.
Leaderboard
Organizers


Medical Image and Data Analysis (MIDAS.lab)
- Sergios Gatidis
- Thomas Küstner
- Pauline Ornela Megne Choudja
- Felix Peisen
- Andreas Wagner

- Clemens Cyran
- Michael Ingrisch
- Jakob Dexl
- Katharina Jeblick
- Balthasar Schachtner
- Andreas Mittermeier
- Anna Theresa Stüber
- Matthias Fabritius

- Ahmed Othman
- Antoine Sanner


Karlsruhe Institute of Technology
